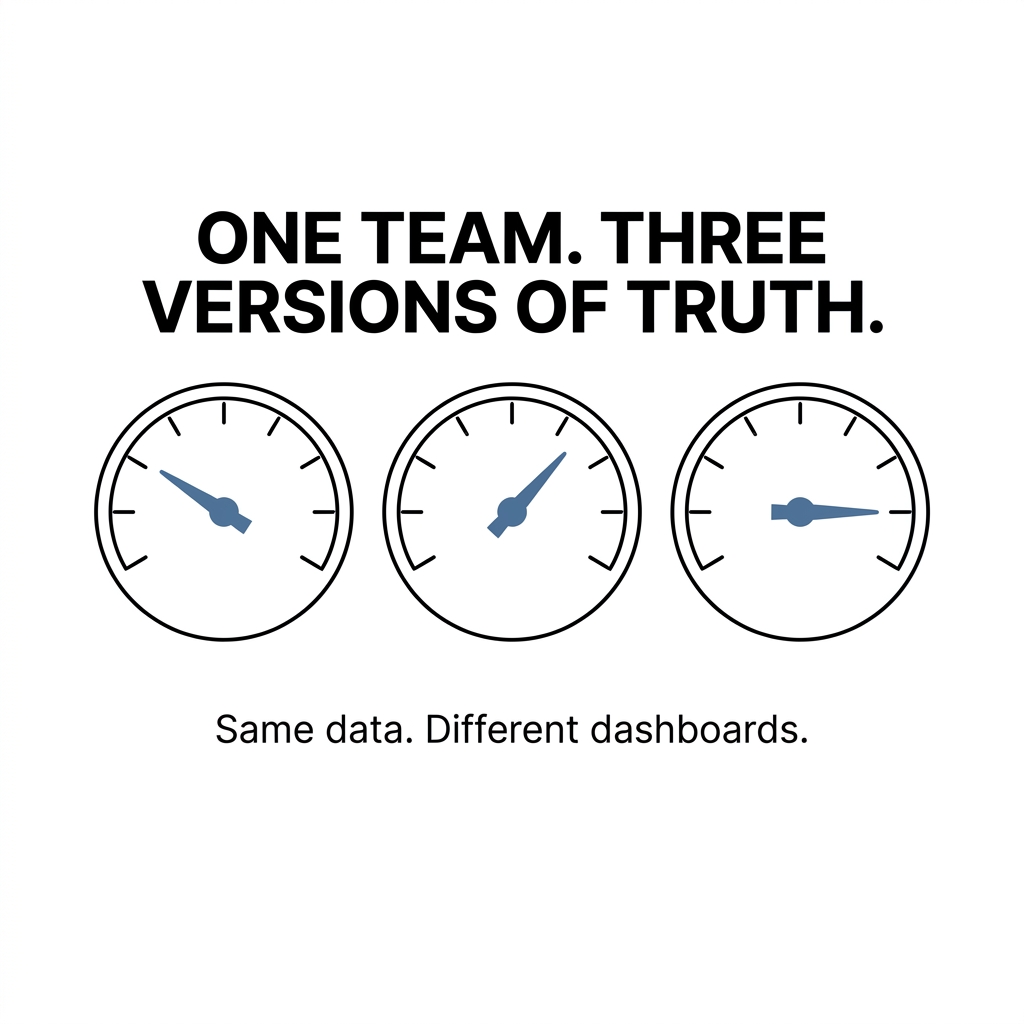
I spent years watching marketing teams argue about numbers that came from the same campaigns.
The web developer had one report. The SEO specialist had another. The person running paid ads had a third. Each report told a different story about the same month.
Nobody was lying. Everyone was looking at a fragment.
That observation sent me digging into how fragmented data actually affects the businesses I work with. What I found convinced me that the dashboard is the strategy. Everything else follows from it.
The Problem Hides in Plain Sight
Here is the pattern I kept seeing when I audited how teams report performance.
The advertising manager measures cost per click. The SEO lead measures rankings. The web team measures page speed. The automation specialist measures open rates.
Every metric is real. Every metric is also local. It describes one function and stays silent about the whole.
Then the monthly meeting happens. Four people present four dashboards. Leadership hears four versions of success and still cannot answer the only question that matters: where do our leads actually come from, and what do they cost?
This is commonly overlooked because each report looks professional on its own. The gap only appears when you try to line them up.
The evidence backs up what I saw in the field. Research shows that 97% of executives say data silos hurt their business operations. When teams see only part of the picture, they duplicate work and act on conflicting information.
That number stopped me. Nearly every executive already knows fragmentation is a problem. Very few have fixed it.
Why "Organizational Neatness" Is the Wrong Argument
Most pitches for integrated marketing focus on tidiness. One agency instead of four vendors. One invoice. One contact person.
I understand the appeal. It also misses the point.
The real value of integrating web, SEO, advertising, and automation sits somewhere deeper: a shared understanding of performance.
When the person building your website sees the same lead numbers as the person managing your ad budget, something shifts. Decisions stop being territorial. The web developer stops optimizing for aesthetics and starts optimizing for the conversion data the ads team lives in every day.
💡 Tip: Before you consolidate any tools, ask each person on your team to name your cost per qualified lead. The spread in their answers shows you exactly how fragmented your data is.
I ran a version of this test with several teams. The answers routinely varied by a factor of three. Same company, same month, same campaigns.
You cannot steer a business with three different speedometers.
Following the Money: What Fragmentation Actually Costs
I wanted to know whether this was an annoyance or a real financial drain. The data points to the second option.
Studies on team alignment estimate that misalignment between sales and marketing costs businesses up to $1 trillion annually in lost productivity. The core mechanism is simple: teams work toward the same revenue goal while measuring success differently.
The cost shows up in three places I can trace directly:
- Time. Teams spend hours each week pulling reports from separate platforms and reconciling discrepancies. Those hours belong in strategy and optimization, the work that actually improves results.
- Budget. When the ads person cannot see organic performance, they pay for clicks the SEO work already earns. Nobody notices because nobody sees both columns.
- Trust. Conflicting numbers in a leadership meeting erode confidence in marketing as a whole. Leaders start treating marketing as a cost center because nobody can show them a clean cause-and-effect chain.
That third cost is the quiet one. Research shows that 47% of CMOs struggle to prove marketing's business impact when performance data lives in separate systems.
Nearly half of the people leading marketing cannot demonstrate what their work is worth. The data exists. It just sits in rooms that never talk to each other.
What a Unified View Actually Changes
I want to be precise here, because "one dashboard" sounds like a software feature. It is a working agreement.
When everyone on a team, internal or external, reads from the same performance data, three things happen in a predictable order.
1. Accountability becomes automatic
Shared metrics force shared accountability. When the web team, the SEO lead, and the ads manager all get measured on lead volume and lead cost, they optimize for the same outcome. Conflicting priorities dissolve because there is nowhere for them to hide.
Companies with strong go-to-market alignment grow 19% faster and are 15% more profitable than their peers, according to research on cross-functional alignment. Every team operates from a single source of truth.
Growth of that size rarely comes from a single tactic. It comes from removing friction between people who already do good work.
2. Decisions speed up
Real-time visibility changes the tempo of a team. When you can see campaign health today, you shift budget today. Teams that rely on exported spreadsheets make spend decisions on day-old data, and in paid advertising a day is expensive.
I watched a team cut a failing ad set within hours because the landing page data and the ad data lived on the same screen. The old process, with two vendors and a weekly report, would have burned budget for another six days.
3. The right questions surface
Fragmented reporting produces defensive questions. Why is your channel underperforming?
Unified reporting produces collaborative questions. The ads bring traffic and the page loses it, so what do we change on the page?
Same data, same people, completely different conversation.
The Objection I Hear Most, and What the Evidence Says
Whenever I make this case, someone raises the cost objection. Centralizing data and reporting sounds like an expensive infrastructure project.
The documented cases point the other way.
The marketing agency Broadhead invested in centralizing its reporting to eliminate data silos. The result: 50% lower management costs, plus the ability to onboard new clients without hiring more people. Unified data opened doors to new service offerings on top of that.
⚠️ Warning: The trap is treating unification as a tooling decision. Buying a dashboard tool while each function keeps its own private metrics changes nothing. The metrics have to merge before the software matters.
How I Would Start, Based on What Works
You can move toward one dashboard without a big-bang project. Here is the sequence I recommend, drawn from the teams I have seen do this well:
- Agree on three numbers. Pick the metrics every function answers to. Lead volume, cost per qualified lead, and conversion rate cover most businesses.
- Map where those numbers live today. List every tool and report that touches them. The list will be longer than you expect.
- Give everyone access to everything. The web developer sees ad spend. The ads manager sees page performance. Access precedes alignment.
- Kill the private reports. One shared view replaces the individual decks. This step meets resistance, and resistance shows up right before something important.
- Review together, weekly. Fifteen minutes, one screen, everyone present. The meeting enforces the habit until the habit enforces itself.
Your first shared review will feel uncomfortable. Numbers that used to live in separate rooms now sit next to each other, and some of them will look worse in context.
That discomfort is the point. It is the sound of a team seeing its real performance for the first time.
The Conclusion I Keep Coming Back To
After following this trail through the research and through my own client work, I land on a simple claim.
Integration pays off through visibility. The organizational neatness, the single vendor, the cleaner invoicing, all of that is a side effect. The core asset is a team where every person, regardless of function, reads the same numbers and pulls toward the same outcome.
One team. One dashboard. One version of the truth.
Start with the test I mentioned earlier. Ask your team for your cost per qualified lead and count the different answers you get.
The size of that spread tells you exactly how much this article applies to you.